DevOps is not a Goal, But a never-ending process of continual improvement
– Jez Humble
Hire Me
Interests: Cloud Computing, Data Science, & Geospatial Mapping.
lethompson@miners.utep.edu
GMT is a very powerful mapping and data visualization package. A map with layers that include mapping topography, earthquake locations, & subduction zones.
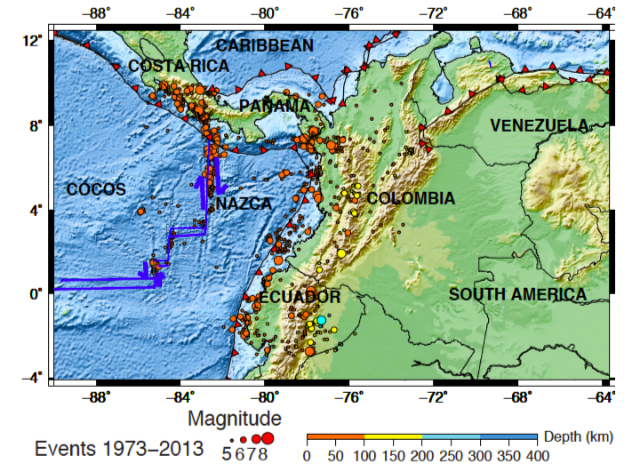
Map #1
Seismicity (earthquake events) map of Colombia region. The lines with red triangles represent a subduction zone. The blue arrows represent fault lines (strike-slip). The different color circles represent earthquakes with different magnitude with respect to depth.
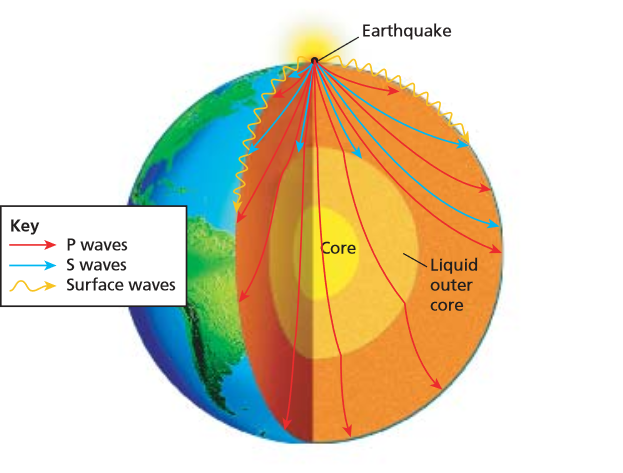
An earthquake occurs due to a sudden release of energy in Earth’s lithosphere. Seismic waves are in fact, the vibrations that carry this energy from the source outwards in all directions.
— Aayesha Arif
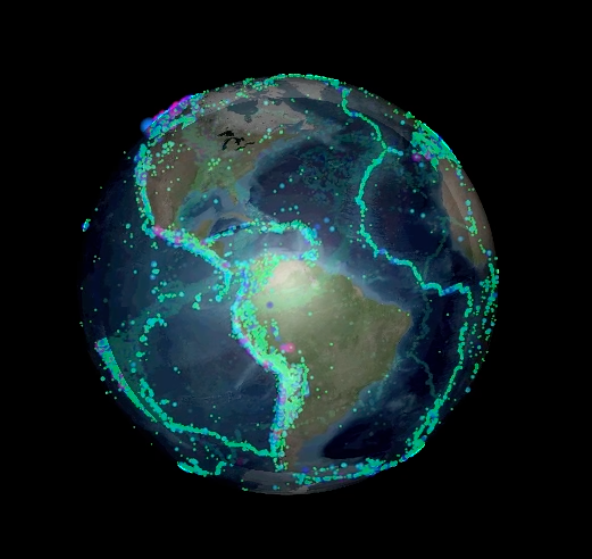
Visualize the distribution and magnitude of earthquakes and explore their distribution at plate boundaries. Earthquakes are visualized on a 3D globe, making it easy to see their distribution within the Earth's surface.
— Cara Harwood