DevOps is not a Goal, But a never-ending process of continual improvement
– Jez Humble
Hire Me
Interests: Cloud Computing, Data Science, & Geospatial Mapping.
lethompson@miners.utep.edu
GMT is a very powerful mapping and data visualization package. Generic Mapping Tools (GMT) is a set of open-source software for mapping and plotting geographic data. It features a command-line interface, which makes it completely different from the common GIS software like QGIS or ArcGIS.
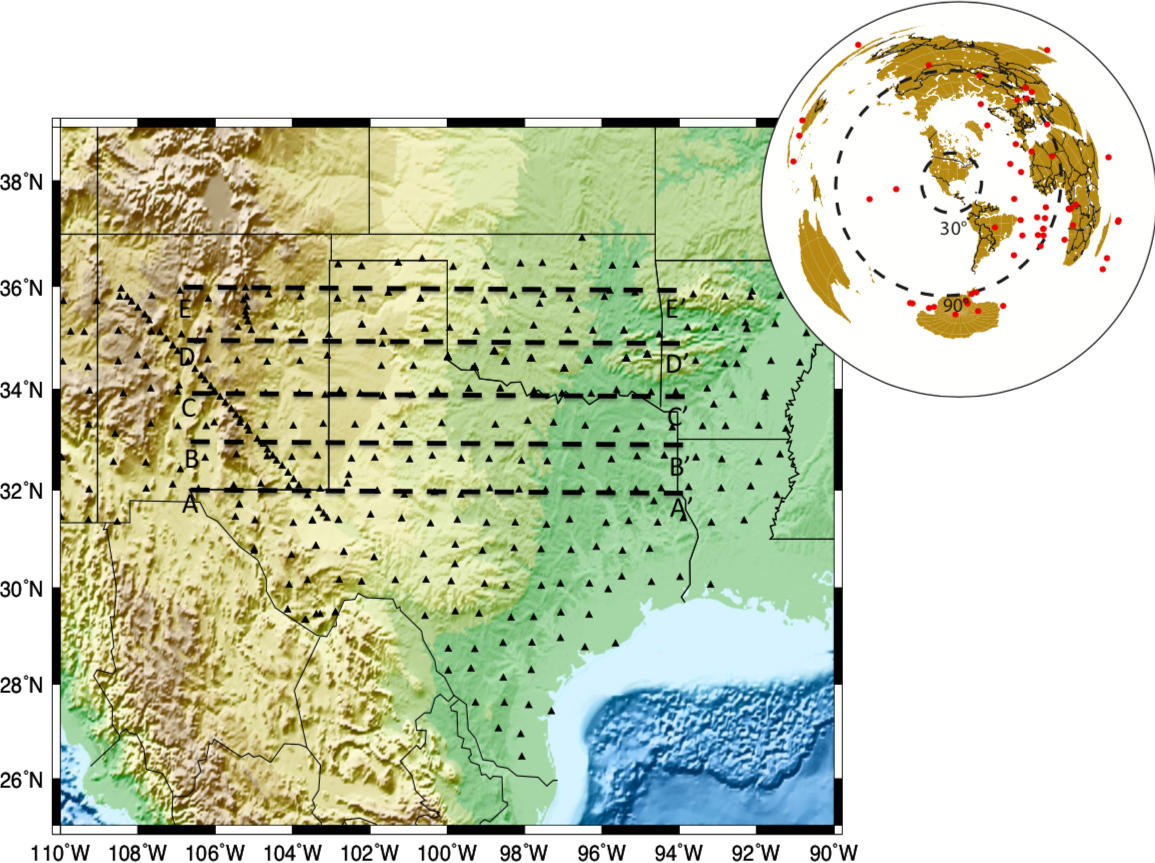
Map #3
Topo map of Texas with the global inset map using the Generic Mapping Tool (GMT). The black triangles represent locations of seismic stations recording earthquake events. The dashed black lines represent seismic cross-sections taken in the texas region for my PhD research. The red circles in the global inset map represent the earthquake events used around the world for my doctoral research.
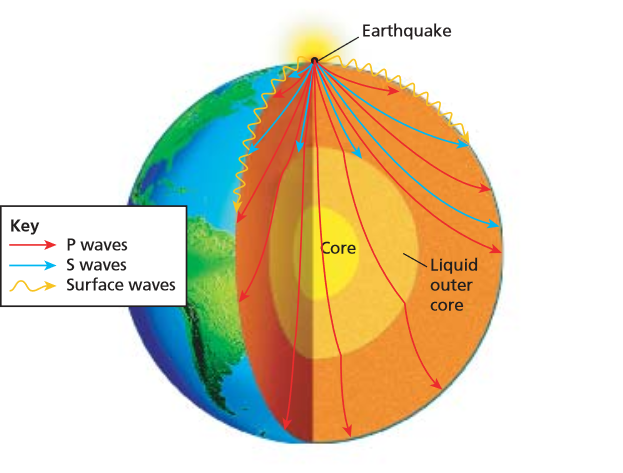
An earthquake occurs due to a sudden release of energy in Earth’s lithosphere. Seismic waves are in fact, the vibrations that carry this energy from the source outwards in all directions.
— Aayesha Arif
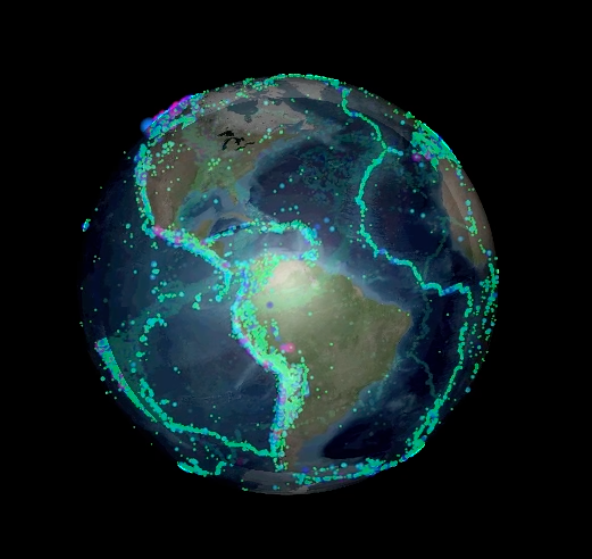
Visualize the distribution and magnitude of earthquakes and explore their distribution at plate boundaries. Earthquakes are visualized on a 3D globe, making it easy to see their distribution within the Earth's surface.
— Cara Harwood